Leonardo Pisano, also known as Fibonacci, is considered the most gifted mathematician of the middle ages. While working on a problem, the Italian mathematician finds these numbers and gives his name to this sequence of numbers. The Fibonacci Sequence is a sequence of numbers obtained by adding each number with the previous number.
The feature of the numbers in this series is that the division of the numbers in the series by the previous number brings us closer to the golden ratio. If we ask what is this golden ratio, the mathematical and geometric calculation that provides the balance of harmony with the parts of the image of the beings is called the golden ratio.
For example, the ratio of our fingers from the upper knuckle to the lower knuckle will bring us closer to the golden ratio. This ratio shows us that the closer it gets to the golden ratio, the more aesthetically perfect it becomes
We said that the Fibonacci sequence is obtained by adding each number with the two preceding it. The Fibonacci Sequence also has an infinite sequence of numbers.
In order to understand the importance of the Fibonacci series, let’s continue with the numbers after talking about the golden ratio. The Fibonacci sequence does not have to start with the number 1. You can start the series with any number. For example; 0-1-1-2-3-5-8-13-is a Fibonacci Sequence, but it can continue as 4-4-8-12-20-32-52-84. In this sequence, the most used ratio in technical analysis is 1.618. This ratio appears when each number in the series is approximately 1.618 times larger than the previous number.
Correction Levels
When Fibonacci retracement levels are used on a chart, they can be used to identify important data such as retracement levels, entry and exit targets, and loss stops, apart from support and resistance levels. support levels, resistance levels
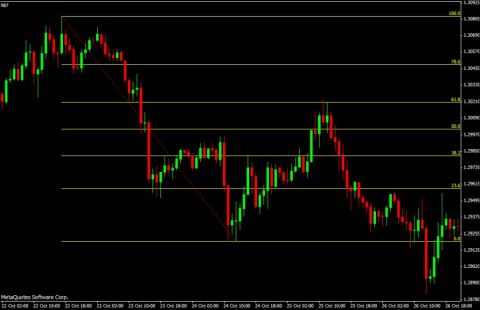
We use Finonacci to predict the future value of financial assets. He generally uses 1.618 and 1.232 ratios in technical analysis. We take the lowest price and the highest price level as data in the time period we will consider. As a result of these data, we obtain expectations about the direction of price movements. Fibonacci offers us analyzes that can help determine the trend that will occur. While doing these, it is based on the rates of 0%, 23.6%, 38.2%, 61.8%, 78.6%, 100%. These levels help traders to predict important levels.
Fibonacci Retracement
In technical analysis, Fibonacci retracement levels are usually obtained by dividing the vertical distance between the high and low points by the Fibonacci ratios. These ratios cut the graph horizontally. These horizontal lines help us identify support and resistance levels.
Investors using this method predict that the price movements that may occur will occur at one of the Fibonacci retracement levels. If the bottom and top points are more than 1, we need to try each point one by one. While deciding which of these points will give more accurate results, we need to work with which price returns work more consistently.
Visits: 74