RSI Indiactor is a Forex Meta 4 plugin program mainly programmed to analyze price change rates with the RSI indicator. It will be effective in making the right decision by directing you to invest with the signals it receives. Typically measured over a 14-day period, the values of the RSI oscillator fluctuate between zero and 100. The Relative Strength Index shows oversold market conditions below 30 and overbought market conditions above 70.
How to Calculate RSI Indicator?
RSI calculations are started as a period. The period used by Welles Wilder and accepted as general use is 14 days. It is also possible to use the period by narrowing or expanding it. As a general rule, when the periods of the indicators are reduced, the indicators become more sensitive to price movements. This means they generate more signals.
The RS value is calculated. The RS value is the ratio of the arithmetic mean (P) of the sum of the positive closing differences in the last 14 days and the arithmetic mean (N) of the negative closing differences of the last 14 days.
The formula is as follows
RS = P/N
RSI = 100 – (100 / (1 + RS))
This formula is to compare increasing days and decreasing days as a percentage. For example, it should be understood that the increase and decrease in the relevant period are balanced on the days when the index takes 50%.
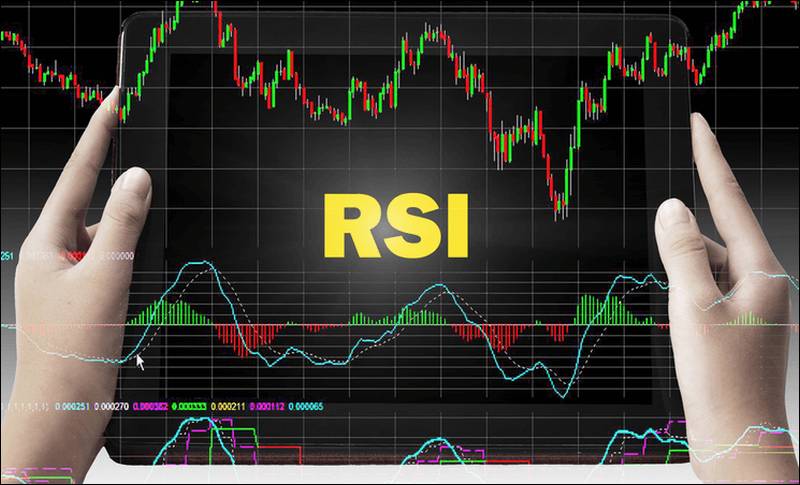
In the graph shown below, we see the 50% value of the above formula drawn. We see the price of the RSI indicator, which shows the bottom level in the downtrend market. After touching 70 levels 2 times, the RSI indicator started to decline again. Here we see that the RSI indicator is working correctly.
How to Use RSI Indicator?
Two limits are set on the RSI indicator, 30 and 70. The region below 30 is indicated as oversold, and the region above 70 is indicated as overbought. If the indicator is in these regions, the current movement is expected to change direction. In particular, returns from extremes are determined as stronger signals.
At trend-strong levels, the RSI can stay in extreme areas for a long time and give false signals. It gives better results in a sideways market than in a trending market. The RSI indicator is generally used by placing it below the price charts.
Visits: 52